


Protest & political violence around the world
Data is near-real time, and updated weekly.
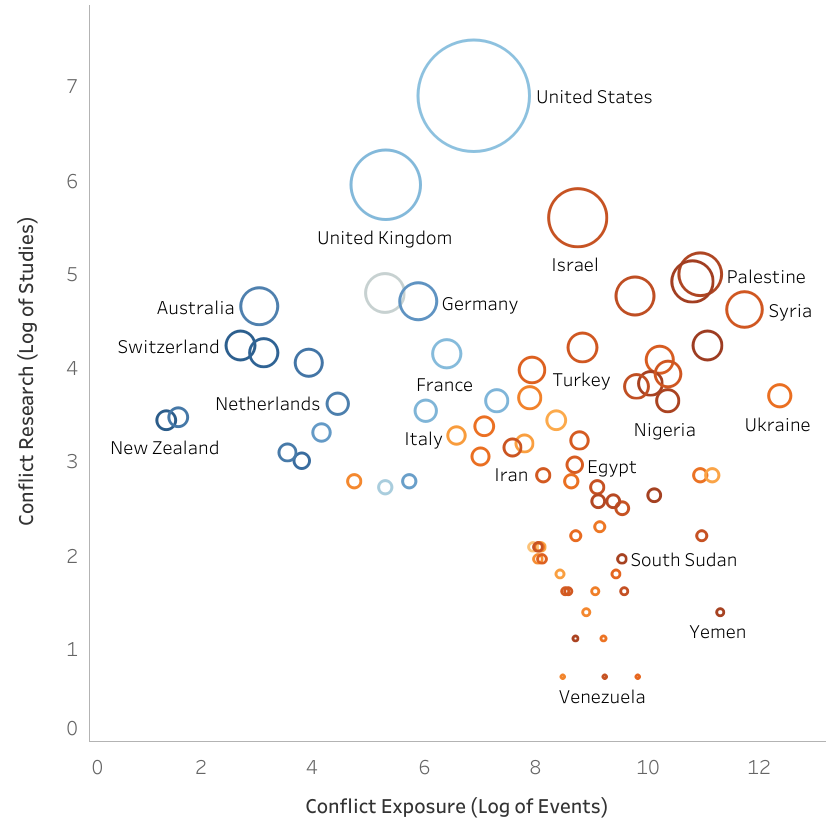
Research attention vs. conflict exposure
Countrywise data, 2000–2025. Analysed from Scopus records of peer-reviewed publications on political violence (n = 7,914; y-axis), and ACLED data on conflict events (n = 749,130; x-axis & colour shading). Credit: Rhea Banerjee.
| Country | Conflict exposure (# events) |
Research attention (# studies) |
|---|
Conflict intensity tracker
Time series of countries by their conflict intensity (1989–2025), measured as overall deaths caused by state & non-state actors. Colour coding is relative to each country's own "worst year", so you can see when violence peaked; switch to the log scale to compare absolute death tolls across countries.
Sources: UCDP (Uppsala Conflict Data Program), Georeferenced Event Dataset (Davies, Pettersson & Öberg, 2026; Sundberg & Melander, 2013). Last update: .